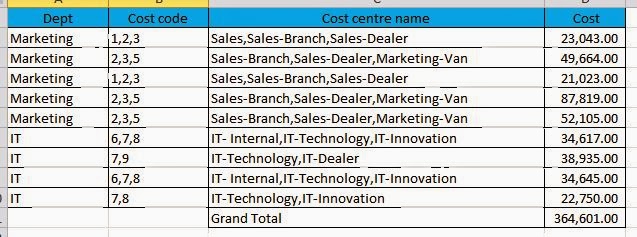
I have been working on a particular job of consolidating cost center wise data of products procured in the past. The problem is that the data is continuous array, separated by commas. The resolution is to first segregate the data first and then show it component wise.
If you have any queries, please mail to me or get back to me in the comments section.
Problem statement: Show sub-department /cost center wise revenue borne.
End result : Should be looking like this.
Resolution steps:
1) Copy the data to be worked on in a separate sheet for easy manipulation.
2) Add sufficient columns, (the number of commas) and browse to Data> Text to columns to segregate the data as below.
3) On the main worksheet, insert sufficient rows (the number of commas).
4) Duplicate the rows from the earlier rows, as it is. From the new and temporary worksheet, copy the data and paste it in the main working file as transpose of it. Same follows for cost centre name as below.
5) Insert sufficient rows for the next item as well.
6) Keep the data to be pasted by preparing a transpose of it.
7) Keep following the above steps, until you completely segregated all data as below.
8) One problem here is the cost, you will see that the total amount has increased manifold because of the multiple line items added. Add two columns, for distributing the cost equally. So if a cost is shared by three cost centres, each of them will bear 100/3 ie 33.3%
9) Prepare the cost centre wise cost, by multiplying the cost with the %ge share for each cost code.
Now you will observe that the total cost is segregated equally.
10) Now the final touch. Select the final table and insert a Pivot table, and select Cost Center code, cost center name under Row labels and Final cost under values as sum.


