I know Windows 7 has been here for some years ago, and I should have written this post some years backup. Nevertheless, I thought it would help many of my other less-techie friends. When Microsoft designed Windows 7's Event Viewer , it was meant to provide the user with more insightful, meaningful, and well-documented events to help better in troubleshooting. For some weeks, my laptop has been taking a long time than usual to boot and hence I take this opportunity to write this post, to test out Event Viewer.
Note: Technical inputs / help taken from Wiki, Google and Microsoft.
Despite all other tweaks done in msconfig, paging, removal of indexing, visual tweaks etc, boot time was taking more time than usual. However it is understandable that it is inevitable to be slow, as I add more applications and utilities with time. In-order to troubleshoot the problem, we need to first identify and pinpoint the issue.Lets use the Windows 7's Event Viewer to investigate the boot time and track down issues that can cause a slowdown in the boot process.
Windows 7's Event Viewer has introduced a new category of event logs called "Applications and Services Logs", which includes a whole host of subcategories that track key elements of the operating system. An event log type called "Operational" is designed to track events that can be used for analyzing and diagnosing problems. There are other event log types as well like Admin, Analytic, and Debug.
Within the operating system section is a subcategory titled Diagnostic-Performance with an Operational log that contains a set of a Task Category called Boot Performance Monitoring. The Event IDs in this category are 100 through 110. By investigating all the Event ID 100 events, you will be able to find out exactly how long it took to boot up your system every time since the day you installed Windows 7. By investigating all the Event ID 101 through 110 events, you will be able to identify all instances where boot time slowed down.
Getting started
Launch Event Viewer by opening the Control Panel, accessing the System and Security category, selecting the Administrative Tools item, and double-clicking the Event Viewer icon or open Run and type "eventvwr" and enter.
Lets start by creating a custom view to filter out the issues.
1. Pull down the Action menu and select the Create Custom View command.

When you see the Create Custom View dialog box, leave the Logged option set at the default value of Any Time and select all the Event level check boxes.
2. Select the By Log option button, if it is not already selected, and click the dropdown arrow.
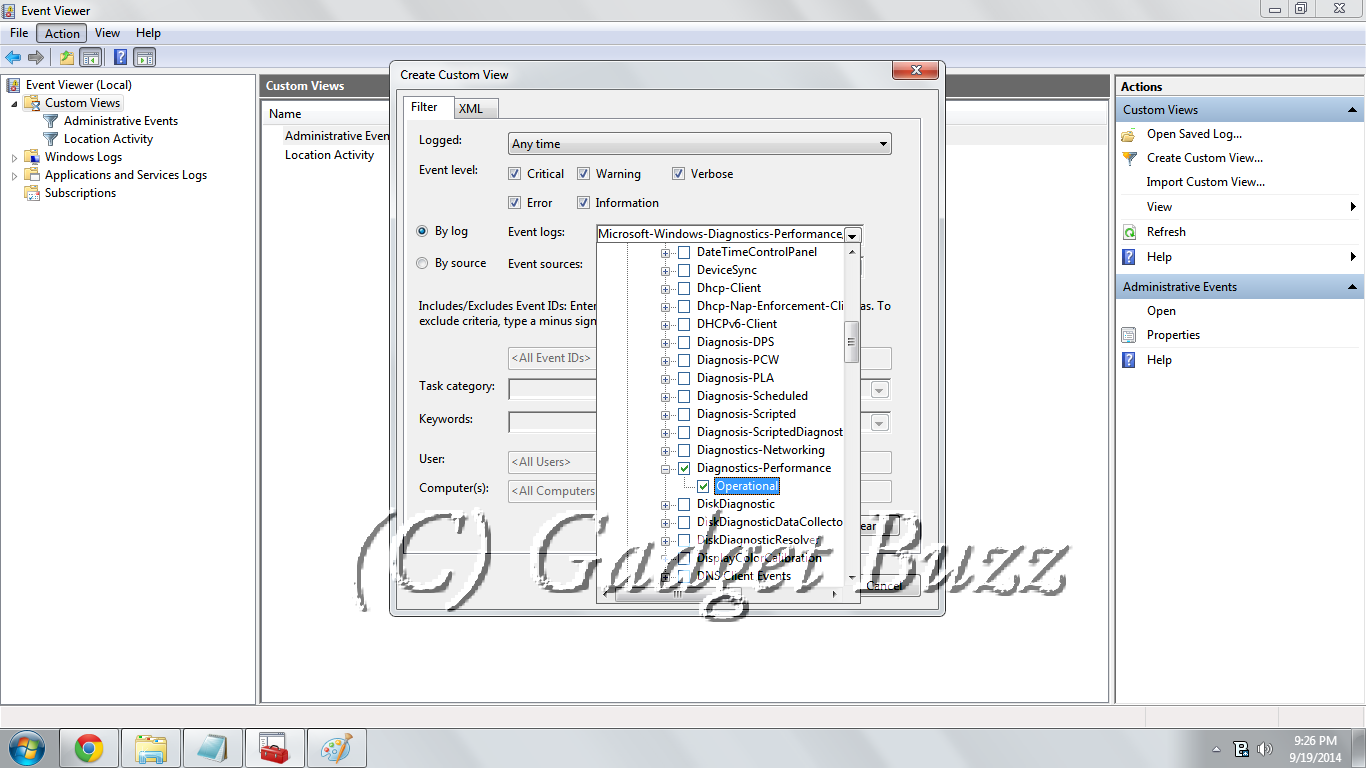
3. Drill down through the tree following the path: Applications and Services Logs | Microsoft | Windows | Diagnostics-Performance.
4. When you open the Diagnostics-Performance branch, select the Operational check box, as shown below.
 5. To continue, type 100 in the Includes/Excludes Event IDs box, as shown below, and then click OK.When you see the Save Filter to Custom View dialog box, enter a name say "Boot Time",and click OK.


6. You'll now repeat these steps and create another Custom View, and this time, you'll type 101-110 in the Includes/Excludes Event IDs box and name it Boot Degrade.


Investigating Boot Time
To investigate the system's boot time, select Boot Time in the Custom Views tree and then sort the Date and Time column in ascending order. When you do, you'll see a complete history of every time you have booted your system since the day you installed Windows 7. Lets hide the Console Tree and the Action Pane to focus on the events.
In any case, by using the Boot Time Custom View, you can scroll through every boot time recorded on your system. Of course, keep in mind that there will be normal occurrences that may lengthen the boot time, such as when updates, drivers, and software is installed.Now, if you click the Details tab, you'll see the entire boot process broken down in an incredible amount of detail, However, for the purposes of tracking the boot time, we can focus on just three of the values listed on the Details tab.
MainPathBootTime
MainPathBootTime gives the amount of time that elapses between the time the animated Windows logo first appears on the screen and the time that the desktop appears.
BootPostBootTime
BootPostBootTime gives the amount of time that elapses between the time that the desktop appears and the time that you can actually begin using the system.
BootTime
BootTime is the same value that on the General tab is called Boot Duration. This number is the sum of MainPathBootTime and BootPostBootTime.

Now lets get deep dive one level down and get to the event IDs.
Event ID 101
Event ID 101 indicates that an application took longer than usual to start up. This is typically the result of an update of some sort. As you can see in Figure F, the AVG Resident Shield Service took longer than usual to start up right after an update to the virus database. If you look at the details, you can see that it took about 15 seconds for the application to load (Total Time), and that is about 9 seconds longer than it normally takes (Degradation Time).

Event ID 102
Event ID 102 indicates that a driver took longer to initialize. This could be the result of an update. However, if it occurs regularly for a certain driver or has a large degradation time, you should definitely look in to a newer version of the driver. If a new version is not available, you should uninstall and reinstall the driver.

Event ID 103
Event ID 103 indicates that a service took longer than expected to start up.

Event ID 106
Event ID 106 indicates that a background optimization operation took longer to complete. On all the Windows 7 systems that I investigated, this event identified the BackgroundPrefetchTime as the culprit.Since the Prefetch cache is a work in progress, this should not really represent a problem.

If you encounter regular or long degradation times related to Prefetch, you may want to investigate clearing this cache and allowing the operating system to rebuild it from scratch. However bear in mind that doing so can be tricky and instructions on doing so are beyond the scope of this article.
As for my issue, i have to dig down logs of a few weeks or months and then arrive to the cause of the issue. I shall deep drive into it and shall inform in my coming posts.
Note: Technical inputs / help taken from Wiki, Google and Microsoft.
Despite all other tweaks done in msconfig, paging, removal of indexing, visual tweaks etc, boot time was taking more time than usual. However it is understandable that it is inevitable to be slow, as I add more applications and utilities with time. In-order to troubleshoot the problem, we need to first identify and pinpoint the issue.Lets use the Windows 7's Event Viewer to investigate the boot time and track down issues that can cause a slowdown in the boot process.
Windows 7's Event Viewer has introduced a new category of event logs called "Applications and Services Logs", which includes a whole host of subcategories that track key elements of the operating system. An event log type called "Operational" is designed to track events that can be used for analyzing and diagnosing problems. There are other event log types as well like Admin, Analytic, and Debug.
Within the operating system section is a subcategory titled Diagnostic-Performance with an Operational log that contains a set of a Task Category called Boot Performance Monitoring. The Event IDs in this category are 100 through 110. By investigating all the Event ID 100 events, you will be able to find out exactly how long it took to boot up your system every time since the day you installed Windows 7. By investigating all the Event ID 101 through 110 events, you will be able to identify all instances where boot time slowed down.
Getting started
Launch Event Viewer by opening the Control Panel, accessing the System and Security category, selecting the Administrative Tools item, and double-clicking the Event Viewer icon or open Run and type "eventvwr" and enter.
Lets start by creating a custom view to filter out the issues.
1. Pull down the Action menu and select the Create Custom View command.
When you see the Create Custom View dialog box, leave the Logged option set at the default value of Any Time and select all the Event level check boxes.
2. Select the By Log option button, if it is not already selected, and click the dropdown arrow.
3. Drill down through the tree following the path: Applications and Services Logs | Microsoft | Windows | Diagnostics-Performance.
4. When you open the Diagnostics-Performance branch, select the Operational check box, as shown below.
5. To continue, type 100 in the Includes/Excludes Event IDs box, as shown below, and then click OK.When you see the Save Filter to Custom View dialog box, enter a name say "Boot Time",and click OK.6. You'll now repeat these steps and create another Custom View, and this time, you'll type 101-110 in the Includes/Excludes Event IDs box and name it Boot Degrade.
Investigating Boot Time
To investigate the system's boot time, select Boot Time in the Custom Views tree and then sort the Date and Time column in ascending order. When you do, you'll see a complete history of every time you have booted your system since the day you installed Windows 7. Lets hide the Console Tree and the Action Pane to focus on the events.
In any case, by using the Boot Time Custom View, you can scroll through every boot time recorded on your system. Of course, keep in mind that there will be normal occurrences that may lengthen the boot time, such as when updates, drivers, and software is installed.Now, if you click the Details tab, you'll see the entire boot process broken down in an incredible amount of detail, However, for the purposes of tracking the boot time, we can focus on just three of the values listed on the Details tab.
MainPathBootTime
MainPathBootTime gives the amount of time that elapses between the time the animated Windows logo first appears on the screen and the time that the desktop appears.
BootPostBootTime
BootPostBootTime gives the amount of time that elapses between the time that the desktop appears and the time that you can actually begin using the system.
BootTime
BootTime is the same value that on the General tab is called Boot Duration. This number is the sum of MainPathBootTime and BootPostBootTime.
Now lets get deep dive one level down and get to the event IDs.
Event ID 101
Event ID 101 indicates that an application took longer than usual to start up. This is typically the result of an update of some sort. As you can see in Figure F, the AVG Resident Shield Service took longer than usual to start up right after an update to the virus database. If you look at the details, you can see that it took about 15 seconds for the application to load (Total Time), and that is about 9 seconds longer than it normally takes (Degradation Time).
Event ID 102
Event ID 102 indicates that a driver took longer to initialize. This could be the result of an update. However, if it occurs regularly for a certain driver or has a large degradation time, you should definitely look in to a newer version of the driver. If a new version is not available, you should uninstall and reinstall the driver.
Event ID 103
Event ID 103 indicates that a service took longer than expected to start up.
Event ID 106
Event ID 106 indicates that a background optimization operation took longer to complete. On all the Windows 7 systems that I investigated, this event identified the BackgroundPrefetchTime as the culprit.Since the Prefetch cache is a work in progress, this should not really represent a problem.
If you encounter regular or long degradation times related to Prefetch, you may want to investigate clearing this cache and allowing the operating system to rebuild it from scratch. However bear in mind that doing so can be tricky and instructions on doing so are beyond the scope of this article.
As for my issue, i have to dig down logs of a few weeks or months and then arrive to the cause of the issue. I shall deep drive into it and shall inform in my coming posts.